Best Car for Uber and Lyft After Every Hidden Cost
Best car for Uber and Lyft ranked by hourly profit after depreciation, charging, insurance, and resale. The winning vehicle type flips by weekly hours.

Every major rideshare vehicle comparison eventually reduces to one chart: fuel cost per mile. That number is usually the smallest differentiator in your actual take-home pay. When you load unpaid charging time, accelerated depreciation at rideshare mileage, insurance premium gaps, maintenance divergence, and resale value erosion into a per-hour profit model, the cheapest-to-fuel option frequently becomes the most expensive to operate. Finding the best car for Uber and Lyft means running that full model, not scanning a pump-price table.
Stay in the loop.
Get the latest posts and exclusive content delivered to your inbox.
Join 13 readers. No spam. Unsubscribe in one click, anytime.
The winning vehicle type is not fixed. It flips at specific thresholds driven by your weekly hours and local charger density. A part-time driver with a home charger faces a completely different cost structure than a 55-hour power driver relying on public fast charging. The rest of this article builds that per-hour profit model across three usage tiers and shows exactly where the crossovers happen.
Why Fuel-Only Comparisons Mislead Rideshare Drivers
Fuel is the most visible cost you have. You watch the meter climb at the pump or see the charging app drain your balance in real time. That visibility creates a trap: drivers optimize aggressively for the expense they can see while ignoring costs that are larger but invisible.
Consider a driver weighing a 50 MPG hybrid against a 30 MPG gas vehicle. At typical fuel prices, the hybrid saves roughly $0.05 to $0.08 per mile. Over 40,000 annual miles, that amounts to $2,000 to $3,200. Real money. But depreciation on a new vehicle driven at that volume can erase several times that figure in a single year, and the depreciation curve differs significantly by powertrain. The fuel gap that dominates online discussions is often less than a quarter of the actual ownership cost gap between vehicles.
This is why the IRS standard mileage rate for business driving bundles depreciation, maintenance, insurance, registration, and fuel into a single per-mile figure. The tax authority does not break out fuel separately because doing so would dramatically understate what it actually costs to operate a vehicle for work.
The Five Costs That Decide Your Real Hourly Profit
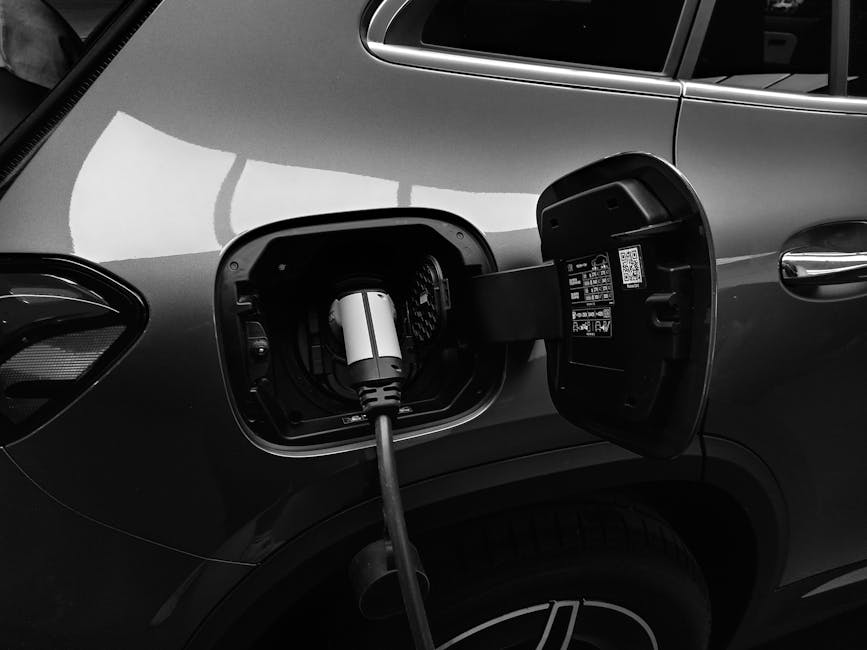
Most vehicle guides mention depreciation in passing and move on. Here are the five cost categories that actually determine which powertrain wins, with concrete mechanisms for each.
Unpaid charging time. For EV drivers without home or workplace charging, every public session is dead time. A Level 2 charger adds roughly 20 to 30 miles of range per hour. DC fast chargers reach 80% in 20 to 40 minutes but cost more per kilowatt-hour and are not always available or functioning. A full-time EV driver relying on public Level 2 charging might spend 8 to 15 hours per week waiting. Those are hours the car is parked and the meter is not running. This is the single cost most online comparisons omit entirely.
Accelerated depreciation. Full-time rideshare drivers commonly put 30,000 to 50,000 miles per year on their vehicles, far beyond the 12,000 to 15,000 miles typical for personal use. Depreciation does not scale linearly at those volumes. A vehicle crossing 100,000 miles in two years hits a steep section of its value curve far earlier than the same vehicle driven normally for six or seven years. This is the core reason Uber driver car depreciation is far worse than personal-use schedules suggest.
Insurance premium gaps. At 40,000 annual miles, the per-mile insurance cost for an EV with a rideshare endorsement can run $0.05 to $0.08 versus $0.04 to $0.06 for a hybrid, per EV insurance costs comparisons. That gap compounds because insurers layer commercial rideshare risk on top of already higher EV repair costs. Over a full year, the difference can exceed $800 in some markets.
Maintenance divergence. EVs do cost less per mile on routine service early on, as EV versus gas maintenance data confirms. But the advantage plateaus and can reverse at rideshare mileage. Drivers who already brake lightly gain little from regenerative braking. EV tires wear faster from battery weight and torque, running $200 to $400 more per set. Above 100,000 miles, battery coolant service intervals arrive and the savings narrow further. Gas vehicles carry higher routine costs but benefit from a mature repair ecosystem. Hybrids split the difference.
Resale value erosion. You will eventually sell the vehicle, and the amount you recover depends heavily on powertrain and odometer. This terminal cost rarely appears in per-mile fuel models, yet it can swing total ownership cost by thousands of dollars.
EV, Hybrid, and Gas Ranked by True Cost per Mile

The table below synthesizes the five cost categories into a directional loaded cost-per-mile range for each powertrain. The ranges were constructed as follows. The IRS standard mileage rate (discussed in the previous section) serves as the total-cost anchor, since it bundles depreciation, maintenance, insurance, and fuel into one government benchmark. The energy row draws on EPA fuel economy data combined with typical retail gas and electricity prices. Insurance figures reflect industry comparisons across powertrain types. Depreciation and resale rows are directional estimates based on aggregated market listings at rideshare mileage levels, not precise figures for any single model. Actual costs vary by location, driving style, specific vehicle, and market conditions.
| Cost Category | EV (public charging) | EV (home charging) | Hybrid | Gas |
|---|---|---|---|---|
| Fuel / energy | $0.04 to $0.07 | $0.03 to $0.05 | $0.06 to $0.09 | $0.10 to $0.14 |
| Depreciation per mile | $0.15 to $0.25 | $0.15 to $0.25 | $0.10 to $0.18 | $0.08 to $0.15 |
| Insurance (rideshare) | $0.05 to $0.08 | $0.05 to $0.08 | $0.04 to $0.06 | $0.03 to $0.05 |
| Maintenance | $0.03 to $0.05 | $0.03 to $0.05 | $0.05 to $0.08 | $0.07 to $0.11 |
| Resale erosion (terminal) | $0.04 to $0.08 | $0.04 to $0.08 | $0.02 to $0.04 | $0.02 to $0.03 |
| Charging time cost | $0.05 to $0.12 | $0.00 to $0.02 | $0.00 | $0.00 |
| Loaded total per mile | $0.36 to $0.65 | $0.30 to $0.53 | $0.27 to $0.45 | $0.30 to $0.48 |
Two patterns stand out. First, the hybrid consistently occupies the lowest or near-lowest position across the range. Second, the EV position swings dramatically based on charging access. An EV with home charging can compete with or undercut a hybrid, but the same EV on public charging lands at or near the top of the cost range.
You can refine the fuel row for candidate vehicles using the EPA database with your local prices. These ranges exclude the vehicle purchase price and any EV tax credit changes that might shift the effective acquisition cost. For context on the revenue side, driver earnings data shows that gross platform earnings vary widely by market and driver tier, making lower per-mile costs especially valuable when margins are thin.
How the Winner Flips Across Three Driver Tiers
The loaded cost-per-mile table gives a baseline, but the real decision hinges on how those costs interact with your weekly hours. Here is how the model plays out across three driver profiles, with specific crossover thresholds you can act on.
Part-Time Driver (15 to 20 Hours per Week)
Annual mileage typically lands between 15,000 and 25,000 miles. Depreciation is significant but not catastrophic, and charging time is manageable because the driver can charge overnight.
EV with home charging is the strongest contender. Fuel costs are minimal, maintenance is low, and charging happens while the driver sleeps.
Hybrid is a close second, offering simplicity and zero charging dependency.
The crossover. Step one is fuel. At $3.50 per gallon, a 50-MPG hybrid saves roughly $1,050 per 15,000 miles against a paid-off 25-MPG gas car. Step two is depreciation. A new hybrid loses several thousand dollars in first-year value the moment it leaves the lot, and at 15,000 annual miles that depreciation exceeds the fuel savings. Below roughly 18,000 annual miles, the gas car you already own wins on total cost. Buy the hybrid only if you will drive enough miles to amortize that initial value drop.
Full-Time Driver (35 to 45 Hours per Week)
Annual mileage climbs to 35,000 to 50,000 miles. This is where the hybrid typically takes the lead.
Hybrid wins on fuel savings that compound across high mileage, predictable depreciation, lower insurance, and zero unpaid charging time. The Prius, Camry Hybrid, and Corolla Hybrid have proven reliability at high mileage, and the Hyundai Elantra Hybrid, Kia Niro Hybrid, and Honda Accord Hybrid round out the strongest contenders with comparable economy and long warranty coverage.
The crossover. An EV overtakes the hybrid on loaded cost per mile only if your home electricity rate is at or below about $0.12 per kWh. At that rate, energy costs roughly $0.034 per mile versus the hybrid's $0.07 at $3.50 gas. Once your home rate exceeds $0.15 per kWh, the EV advantage shrinks to roughly $0.03 per mile, barely enough to offset higher insurance and resale erosion.
Gas becomes less competitive as maintenance scales with mileage, though a paid-off reliable gas car still delivers positive cash flow.
Power Driver (50-Plus Hours per Week)
Annual mileage can exceed 50,000 miles, pushing toward 150,000-plus miles in three years.
Hybrid remains the default winner, but the margin tightens. Battery replacement and drivetrain wear become real above 150,000 miles.
The crossover. At extreme mileage, a $6,000 to $8,000 used gas car can win on total profit despite costing more per mile to operate. If a used gas car depreciates by only $3,000 over its remaining life while a hybrid or EV loses $10,000-plus in resale at the same odometer, the gas car's higher per-mile costs are absorbed by lower depreciation. The break-even lands near 100,000 to 120,000 additional miles. Below that, the hybrid wins on operating costs.
EV faces its toughest case. Battery degradation compounds, resale value collapses, and charging time multiplies. Only a power driver with dedicated home charging and exceptional battery longevity should consider this path.
How Charger Density Shapes EV Rideshare Viability
Local public charging infrastructure is the single largest external variable in whether an EV works for full-time rideshare. In metros with dense DC fast charger networks, an EV driver can find working chargers within minutes of most locations. In EV-friendly metro areas, public charging is woven into grocery runs, parking structures, and highway corridors.
In suburban or rural markets with sparse coverage, the picture changes entirely. Drivers may drive 15 to 20 minutes to reach a functioning fast charger, wait 30 to 45 minutes for a charge, and repeat multiple times per shift. That can consume 10 to 15 unpaid hours weekly, converting what looks like a $25-per-hour gross earning period into something closer to $17 to $19 net after charging dead time.
Level 2 charging times make this worse for anyone relying on public Level 2 stations, since a near-full recharge can take four to eight hours. If your only charging option is a public Level 2 plug at a grocery store or library, the math simply does not work for full-time driving.
The practical test: map every DC fast charger within a ten-minute drive of your typical operating area. If you count fewer than three reliable locations, an EV is a high-risk choice for full-time rideshare unless you have home charging.
Resale Value Erosion at Rideshare Mileage
Most EV battery warranties expire at eight years or 100,000 miles. A full-time rideshare driver hits that odometer in two to three years, meaning the vehicle exits warranty precisely when its resale value is most exposed to battery replacement risk. That is the warranty cliff, and it is why high-mileage EVs face a steeper resale penalty than comparable gas vehicles at the same odometer.
Data on EV battery health shows capacity loss accelerates with age and miles, and used buyers discount accordingly. Used EV resale values for models like the Kia EV6 confirm depreciation curves steepen sharply past the 100,000-mile warranty threshold. An earlier 2019 value retention study suggested some EVs held value well, but that predates the price cuts and model refreshes that reset the used market.
The penalty is concrete. At a $35,000 purchase price, the gap between an EV retaining 45% versus 25% after three years of rideshare use is $7,000, adding roughly $0.09 per mile over 80,000 miles. That single terminal cost exceeds the entire fuel savings most drivers celebrate.
Best Car for Uber and Lyft by Driver Profile
Before buying, leasing, or switching, work through this sequence.
Check platform requirements. Confirm your candidate vehicle meets Uber vehicle requirements for age, seating, and condition. Lyft maintains similar standards.
Estimate annual mileage honestly. Multiply your average weekly hours by your typical miles per active hour (often 20 to 30 in urban markets, higher in suburban). Most drivers significantly underestimate this.
Assess charging access. If you lack home or workplace charging, map public DC fast chargers in your operating area and estimate weekly charging time. Multiply that time by your average gross hourly rate to calculate the opportunity cost.
Pull insurance quotes for all three powertrains with a rideshare endorsement before deciding. The premium gap can exceed $500 to $1,000 annually in some markets.
Project resale value at your expected exit mileage. Look at current used listings for your candidate vehicle at the mileage you expect to reach in two to three years.
Run the loaded cost per mile. Use the five-category framework above to estimate total operating costs, then divide by projected annual miles. Compare against your average gross per mile.
The best car for Uber and Lyft is the one that delivers the highest net hourly profit after every cost is loaded. For most full-time drivers, that is a proven hybrid like the Prius, Camry Hybrid, or Corolla Hybrid. For part-time drivers with home charging, a Chevrolet Bolt or Tesla Model 3 can win on low energy and maintenance costs. For power drivers logging 50,000-plus annual miles, a used Corolla or Civic can deliver the lowest total cost despite higher fuel spend, because depreciation exposure stays minimal. Run the numbers for your situation, because the vehicle that looks cheapest at the pump is rarely the one that puts the most money in your account.
Stay in the loop.
Get the latest posts and exclusive content delivered to your inbox.
Join 13 readers. No spam. Unsubscribe in one click, anytime.
About the author
Ryan Callahan
Staff Writer
Ryan reports on extra-income opportunities and personal finance, including side hustles, money-making apps, and investing basics, with a focus on clear, practical analysis.
Related Posts

How Uber Calculates Driver Pay, and How to Audit It
How Uber calculates driver pay now runs through upfront pricing and batch matching. Learn the system on Uber and Lyft, then audit 14 days of trips.

Gig App Deactivation Can Cost Six Weeks of Pay
Gig app deactivation is a priceable income risk. Size the exposure, run the first 72 hours, and pre-build a multi-app stack that protects your pay.

Robotaxi Impact on Gig Driver Pay, 5 Signals and a Hedge
The robotaxi impact on gig driver pay lands metro by metro. Track the 5 trip-log signals monthly, then hedge rideshare income in staged moves.