GigU Driver Pay in 2026, the Fully Loaded Audit
GigU driver pay in 2026, audited: real hourly earnings after deadhead miles, insurance gaps, and thin ride volume, benchmarked against Uber.
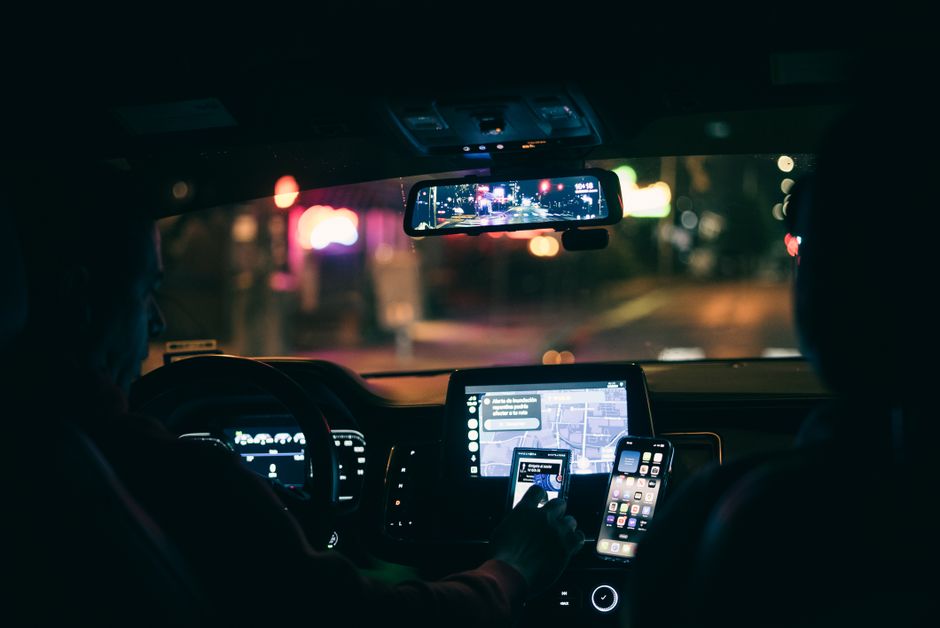
GigU driver pay starts with a division, not a headline fare. A $22 offer for a 10-mile trip looks like real leverage until the map loads and the pickup is 9 miles away, which drops the offer to $1.16 per total mile and about $7.40 an hour net. GigU exists to put that division in front of you before you tap accept. The offer belongs to the platform; the hour is still yours to lose.
Stay in the loop.
Get the latest posts and exclusive content delivered to your inbox.
Join 15 readers. No spam. Unsubscribe in one click, anytime.
This audit prices GigU the way we price every gig app on this site, by decomposing every offer into unpaid pickup miles at the IRS cost basis, idle time, the underlying platform commission, and the insurance exposure you personally carry. The verdict up front: offers screened through GigU beat your existing Uber effective rate only when they clear a strict fare-per-mile screen. Accept everything that arrives without running the division, and thin early-market offer flow usually leaves you earning less per hour than on the platform you already drive. Every number below is a worked example you can rerun with your own city and cost inputs.
How GigU works for drivers
GigU is not another marketplace with its own riders. Per The Rideshare Guy's GigU review, it is a companion app that sits beside the platforms you already drive and reads their incoming offers, Uber, Lyft, and DoorDash included, without asking for your credentials on any of them. For every offer it computes earnings per mile, earnings per hour, and estimated net profit, and its Cherry Picker feature grades the offer green, yellow, or red against earnings targets you set yourself. Accepting or declining still happens on the platform. GigU's job is making the math visible before you tap.
The app's own pay analysis, and its price tag
Those grades are the right starting point for a GigU driver pay audit, because the app is already doing part of the decomposition for you. Two availability facts bear on pay directly: GigU runs on Android now with an iOS waitlist open, and it is free through the end of 2026. After 2026, the app's own pricing becomes a cost input to watch, stacked on top of the underlying platform commission, the take assumed at a placeholder 20 percent in the worked examples below.
Incoming offers scatter widely, platform by platform and hour by hour, and they quietly die in the places a green grade can hide: deadhead miles to the pickup, idle minutes between offers, and the commission behind the fare. An offer can grade green and still lose money on a 9-mile pickup, which is why the rest of this article loads those costs back in before you trust a single grade.
The audit method, from advertised fare to net hourly
The whole model is one line, and every worked example below is this line with different numbers plugged in:
net_per_hour = (fares x (1 - commission) - total_miles x mileage_rate) / online_hours
total_miles  = pickup_miles + trip_miles
online_hours = engaged + pickup + idle
Walk one small offer through it before the tables arrive. A $16 fare for a 6-mile trip with a 4-mile pickup means 10 total miles, pickup plus trip. Commission, the underlying platform's take on the fare, assumed at 20 percent, leaves $12.80. Costing the miles at the IRS standard mileage rate, 70 cents per mile in 2025 and adjusted most years, takes another $7.00. $5.80 of the $16 survives, and not a single idle minute has been counted yet.
The two terms that quietly decide everything sit in the formula's second and third lines. Pickup miles are miles driven to the rider that earn nothing and cost everything a mile costs. Idle minutes are online time spent waiting for offers, which no platform quotes in its marketing, and online hours means engaged, pickup, and idle minutes together. The mileage rate bundles gas, maintenance, depreciation, and insurance wear into one defensible number, which is why it is the cost basis instead of guessed fuel prices.
Run it on any platform, any week. The inputs that decide the answer, pickup distance and idle time, are exactly the ones a fare quote never shows.
GigU driver pay per hour, the worked math
The question of how much GigU drivers make per hour has an honest answer shaped like a wide range, because incoming offers scatter offer by offer. Example one prices a typical unscreened hour.
Example one, a typical unscreened hour
Assume a moderately busy launch-city evening: two completed rides per online hour, each paying $16 for a 6-mile trip, a 4-mile pickup each time, 10 minutes of total idle, and the assumed 20 percent commission.
| Line item | Math | Amount |
|---|---|---|
| Rider fares | 2 x $16 | $32.00 |
| Commission, assumed 20% | $32 x 0.20 | −$6.40 |
| Vehicle cost, 20 total miles | 20 x $0.70 | −$14.00 |
| Net for the online hour | $11.60 |
Twelve of those twenty miles, 60 percent, earned nothing. That single line converts a $32 gross hour into an $11.60 net hour, and no advertised fare fixes it from the driver's seat; only screening does. Note also that this example assumes offers keep arriving, which in a young market is the flattering assumption.
How deadhead miles erode GigU offers

Example two, the long-pickup loss ride
$22 for a 10-mile trip reads well at $2.20 per trip mile. Add the 9-mile pickup and the offer is 19 total miles at $1.16 per mile. After the assumed commission you keep $17.60, mileage costs $13.30, and 35 minutes of work returns $4.30, roughly $7.40 an hour net. The trip itself was fine. The pickup was the ride.
Example three, the spread-out market
Long pickups are a geography problem, not a GigU one; the riders sit on the platforms you already drive. In dense, mature zones, pickup distance commonly runs a quarter to a third of total miles. When riders are spread across suburbs, it can approach half. Research on rideshare deadhead miles measures unpaid driving as a large share of total platform miles, commonly estimated near 40 percent in US data, and sparser markets tend to run worse than dense ones.
The number that decides profitability is fare per total mile, pickup included, not fare per ride and not fare per trip mile.
Before accepting any offer, divide the fare by pickup miles plus trip miles. If the division fails, decline and let the next one load.
The insurance question before you drive with GigU

GigU never touches the ride itself. Grade offers through a third-party layer all you like; the miles still run under the riding platform's contingent coverage plus your personal policy, so the documents that decide what is covered are the platform's driver agreement and your insurer's endorsement, two separate papers. GigU is neither of them.
What your personal policy excludes
Personal auto policies generally exclude carrying passengers for money, a position the Insurance Information Institute states plainly in its rideshare guidance. The NAIC's commercial ridesharing guide maps how coverage splits between your personal policy and the platform's contingent policy across the periods of a ride, app on, en route to pickup, on trip.
The gray zone is the overlay itself. Platform terms and rideshare endorsements were written before third-party offer-grading apps existed, so neither anticipated one. Ask your insurer directly whether the endorsement says anything about how offers are viewed or accepted, and search each platform's driver terms for language about third-party tools before you trust a green grade on the road.
The verify-before-driving checklist
- Read the insurance section of each riding platform's current driver agreement, and screenshot it.
- Confirm your own rideshare endorsement with your insurer, and price the gap.
- Read GigU's own terms of service as a third, separate document, and note what it says about liability.
- Re-verify after updates on any of the three. Early-market terms change without ceremony.
Ride volume and idle time in early GigU markets
GigU arrived in the US from Brazil, per GigU's US expansion announcement, and its first American integrations are exactly that, first. The app has no riders of its own to be thin; offers arrive from Uber, Lyft, and DoorDash. Your idle risk runs through two channels: unproven offer integrations in first cities, and your own screen, because every declined offer is idle time you chose. Marketplace liquidity research still backs the structural point that thin two-sided markets pay badly, since riders will not wait for scarce drivers and drivers will not idle for scarce riders.
The consequence for pay is blunt. In early cities, idle time, not fare size, is usually the binding constraint. A $30 ride that arrives every 90 minutes is a $20 gross hour, full stop, which is why the honest unit is gross fares per online hour, never per ride.
The one-week volume test
Run five three-hour sessions in the same blocks you already drive Uber. Log three numbers per session: offers received per online hour, median minutes between offers, and how many offers pass your fare-per-mile screen. If screen-passing offers arrive less often than roughly one per 20 online minutes, treat screen-only driving in your city as unproven and keep Uber as the volume engine.
GigU versus Uber, the effective hourly rate
GigU vs Uber, which pays more per hour, is the right question asked about the wrong numbers. Uber's public US driver earnings figures are quoted per engaged hour and before expenses, which flatters them twice: idle minutes vanish, and so do vehicle costs. An expense-adjusted 2025 net Uber earnings study lands well below the engaged-hour headline once both load back in.
Build your own baseline instead of borrowing a city average. Take last month's Uber gross, subtract total miles times the IRS rate, and divide by online hours, not engaged hours. Whatever survives is your Uber effective rate, and that is the number GigU driver pay has to beat.
| Uber effective hour | GigU unscreened | GigU screened | |
|---|---|---|---|
| Basis | your history, 17 total miles | example one, 20 total miles | 2 rides at $24, 3-mile pickups, 6-mile trips, 18 total miles |
| Gross | $32.00 | $32.00 | $48.00 |
| Commission, assumed 20% | −$6.40 | −$6.40 | −$9.60 |
| Vehicle cost at $0.70/mile | −$11.90 | −$14.00 | −$12.60 |
| Net per online hour | $13.70 | $11.60 | $25.80 |
Figures are illustrative from the worked examples; rebuild them with your own inputs. The pattern holds regardless: Uber's liquidity delivers mediocre fares at industrial volume, while GigU turns thin offer flow into selectivity through screening. Those are different machines, and the second one only pays a driver who operates the screen.
A per-ride screen for accepting GigU offers
Calibrating the floor you plug into GigU
The app computes the grades, but it cannot choose your targets for you, and a green grade is only as honest as its inputs. Tell it $20 an hour while your market feeds you 9-mile pickups, and it will grade losing offers green all shift. So here is worked example four: deriving the floor from deadhead-inclusive total miles, the number your targets should come from.
Pick a target net per hour, say $25. Estimate your total miles per online hour at your average pace including pickups and idle, say 20. Your fares must cover the target plus mileage cost at the IRS basis and then survive the commission, assumed 20 percent, so solve for the gross fare before the platform's take:
required_fare_per_hour = (target_net + total_mph x mileage_rate) / (1 - commission)
floor_per_mile        = required_fare_per_hour / total_mph
At $25 and 20 total mph with the 70-cent rate: $25 + $14 = $39 to cover, and $39 / 0.80 = $48.75 per hour in gross fares, so $48.75 / 20 = $2.44 per total mile, illustrative. That is what your green line in GigU should mean: fare divided by pickup plus trip miles, at or above the floor. Accept when an offer clears it, decline when it does not. The decision is binary on every platform, and the floor is what makes it fast.
| Target net per hour | 15 total mph | 20 total mph | 25 total mph |
|---|---|---|---|
| $20 | $2.54 | $2.13 | $1.88 |
| $25 | $2.96 | $2.44 | $2.13 |
| $30 | $3.38 | $2.75 | $2.38 |
Floors assume the 20 percent commission and the 70-cent rate; regenerate with your own inputs.
The stacking rule
GigU earns its keep as the decision layer across every platform you already drive, never as a reason to add hours. Keep Uber as your default volume, because its liquidity is the baseline to beat. Take the graded Lyft or DoorDash offer only when it clears your floor with margin, when Uber goes quiet, or in zones Uber underserves. Never sit idle waiting for a screen-passing offer during hours Uber reliably surges. Accept or decline at the floor every time, with no exceptions for greens that miss it.
Who should drive GigU in 2026
Is GigU worth driving for in 2026? Conditionally, and the condition is you.
- The screener. If you already compute dollars per mile in your head, GigU's grades plus your own floor turn that instinct into a fast accept-or-decline call on every offer. Strong fit.
- The stacker. Multi-app drivers get the best case: GigU as a screened overflow layer on top of Uber, capturing premium offers without surrendering liquidity.
- The primary-platform seeker. If you want one app and a full schedule, wait. In a young market, volume has to prove itself before it can pay you.
Go or no-go checklist for your city: each riding platform's insurance terms verified per the checklist above, a one-week volume test producing screen-passing offers at roughly one per 20 online minutes or better, and a floor that clears your own Uber effective rate. Getting started is an Android install today, with iOS on an early-access waitlist, and the app is free through the end of 2026. Recheck commission terms and that pricing quarterly, because early-market terms move.
Revisit the opening offer. $22 for 10 miles with a 9-mile pickup failed at $1.16 per total mile. A $19 offer for a 5-mile trip with a 2-mile pickup clears at $2.71 and nets $10.30 per cycle after the assumed commission and mileage, which tops $30 an online hour only when three such cycles land inside it. Same app, same night, opposite outcomes. Offer selection plus your own floor hands you the steering wheel. The screen is how you drive.
Stay in the loop.
Get the latest posts and exclusive content delivered to your inbox.
Join 15 readers. No spam. Unsubscribe in one click, anytime.
About the author
Ryan Callahan
Staff Writer
Ryan reports on extra-income opportunities and personal finance, including side hustles, money-making apps, and investing basics, with a focus on clear, practical analysis.
Related Posts
How Uber Calculates Driver Pay, and How to Audit It
How Uber calculates driver pay now runs through upfront pricing and batch matching. Learn the system on Uber and Lyft, then audit 14 days of trips.

Best Car for Uber and Lyft After Every Hidden Cost
Best car for Uber and Lyft ranked by hourly profit after depreciation, charging, insurance, and resale. The winning vehicle type flips by weekly hours.

Gig App Deactivation Can Cost Six Weeks of Pay
Gig app deactivation is a priceable income risk. Size the exposure, run the first 72 hours, and pre-build a multi-app stack that protects your pay.