Investing During a Recession With Side Hustle Income
Investing during a recession with side hustle income, grounded in how stocks, bonds, REITs, Treasuries, and cash behaved in 2001, 2008, and 2020.

Investing during a recession gets pitched as a picking problem: find the recession-proof investments, hide inside them, and wait out the storm. That advice quietly assumes your paycheck keeps arriving on schedule while markets fall. For the millions of US adults earning gig, freelance, or platform income, the assumption fails at the worst possible moment. Side hustle revenue tends to soften in the same months that consumer spending tightens, and consumer spending is what stocks, high-yield bonds, and REITs are priced on. Your income drawdown and your portfolio drawdown arrive together.
Stay in the loop.
Get the latest posts and exclusive content delivered to your inbox.
Join 20 readers. No spam. Unsubscribe in one click, anytime.
That correlation changes the question. Ask not which asset falls least, but which assets fall least while your own revenue is falling, and how much cash belongs on the shelf so you never have to sell the rest at the bottom. The documented record from 2001, 2008, and 2020 answers the first question with real numbers, and it points directly at a tiering method for the second.
Why Investing During a Recession Starts With Your Income
Risk tolerance is psychological: how large a paper loss you can watch without flinching. Risk capacity is arithmetic: how many months your cash can carry you if income stalls. Standard portfolio advice weighs both, but familiar defaults, including the three-to-six-month emergency fund rule, quietly assume a salary. A hustler faces an extra layer, revenue that moves with the business cycle.
Rideshare and delivery demand, tips, freelance retainers, ad budgets, and resale activity all track household and business spending. When that spending contracts, these streams contract with it, and many hustlers also hold day jobs in the same cyclical corners, retail, hospitality, logistics, which stacks the exposure. Roughly three in ten US adults reported doing some form of gig work in recent years, and irregular income is one of the most common financial fragilities that the Fed's SHED survey documents. Research on platform earnings such as How Big Is the Gig? keeps finding the same pattern: small amounts, high variance.
The consequence is uncomfortable but clarifying. A salaried investor with a secure job can rationally buy stocks as they fall. A side hustler watching orders thin out or contracts pause is being hit in the income column and the portfolio column at once, which is exactly when the urge, or the need, to sell shows up. Risk capacity, not risk tolerance, is the binding constraint. That reframing drives every recommendation below.
What Actually Happened in the 2001, 2008, and 2020 Recessions
Three episodes, three different shapes, and the differences decide what your money experienced:
| Recession | NBER peak to trough | Shape | Equity bear market |
|---|---|---|---|
| 2001 | March to November 2001 | Eight months, shallow, weak job recovery | March 2000 to October 2002, the longest of the three |
| 2007 to 2009 | December 2007 to June 2009 | Eighteen months, deep, financial crisis at the core | October 2007 to March 2009 |
| 2020 | February to April 2020 | Two months, steepest contraction on record, immediate stimulus | February to March 2020 |
The dates come from NBER's official cycle chronology, the academic arbiter of US recessions. Two details matter for investors. First, equity bear markets began well before the official peaks in 2000 and 2007, and the 2000 to 2002 bear outlasted its recession by roughly a year, punishing anyone who equated "recession over" with "stocks safe." Second, the NBER dates cycles with a long lag, so by the time an episode is official, markets have usually priced a good part of it already. Waiting for the announcement is not risk management.
How Stocks Perform in a Recession, in Actual Numbers
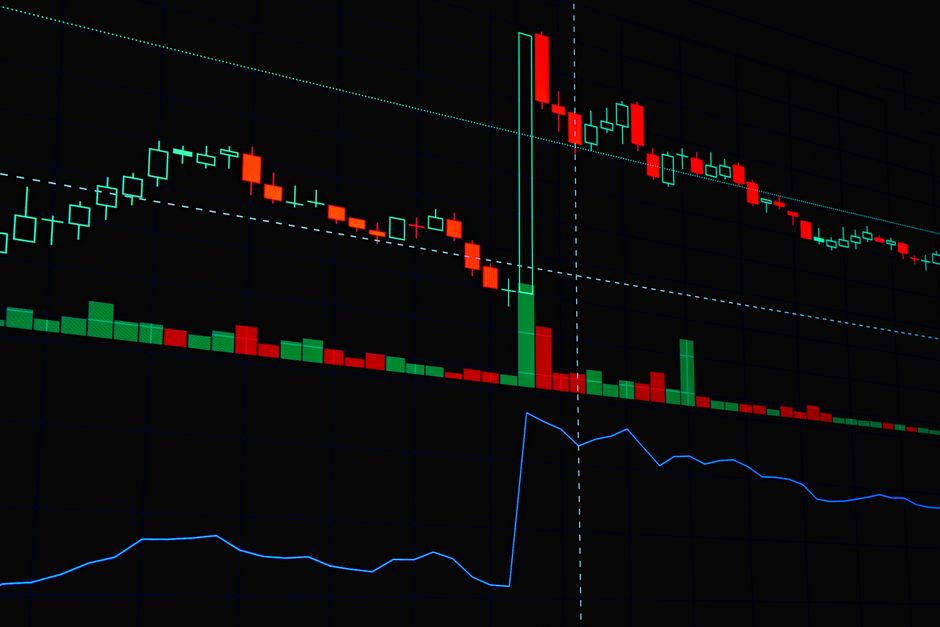
"How much did the S&P 500 drop in 2008" is among the most searched recession questions, and the answer sets the bar for what any risk-tier dollar must be able to sit through.
- 2000 to 2002: a peak-to-trough decline of roughly 49 percent
- 2007 to 2009: roughly 57 percent
- February to March 2020: roughly 34 percent
Those price drawdowns come from the record of every major correction since 1950, and the deeper difference is the recovery clock. The 2020 crash round-tripped with astonishing speed: the index regained its prior high within about six months, helped by zero rates and direct stimulus payments. After the 2009 bottom, reclaiming the 2007 peak took roughly four years, and the 2002 bottom needed about four and a half years to retake the 2000 high, per a timeline of market crashes. So, did stocks recover faster in 2020 than in 2008? Emphatically, and treating that as the new normal is the error. The 2020 episode paired a two-month recession with the fastest policy response in modern history. Plan on 2008-style arithmetic instead: a drawdown that can run for more than a year and a recovery measured in years.
For a variable earner, the practical translation is a horizon rule. Equity money you might need to spend within three to five years of a possible downturn is a forced-seller position waiting for a bad month, not investment capital.
Are Bonds Safe in a Recession? Depends on the Bond
The word "bond" hides two opposite instruments. Treasury paper is a safety asset. High-yield corporate paper, the politely named junk tier, is equity risk wearing a coupon.
Watch the spread, the extra yield junk demands over Treasuries. The ICE BofA high-yield spread series sits in the low single digits in calm markets, spiked to roughly 20 percentage points in late 2008, and to roughly 11 points in March 2020. Moves of that size mean existing junk bonds lose a lot of price, and the broad high-yield index lost roughly a quarter of its value in 2008. Defaults arrive as the slower second act, with the speculative-grade default rate climbing steeply into 2009, as Moody's default data tracked month by month.
The lesson for a hustler is correlation timing. Junk sold off alongside equities in precisely the months when liquidity mattered most, which means the asset you reach for to raise cash reliably gets cheaper when you need cash. In a high-yield bonds vs Treasuries comparison during a recession, only one side has historically acted as the hedge.
What Happened to REITs in 2008 and 2020
REITs during a recession get pitched as income machines, and the pitch lands hardest on side hustlers, because a REIT dividend is the passive income you are working toward: a check that arrives whether or not you drive, deliver, or invoice this month. 2008 stress-tested that promise, and the check behaved like gig income, not like a coupon, cut in exactly the months household spending contracted and your own orders thinned out.
The price damage alone was severe. The FTSE Nareit All Equity REITs index lost roughly 38 percent on a total-return basis in 2008, and the second hit landed on the holders who stayed: a wave of dividend cuts and suspensions through late 2008 and early 2009, then new equity issued at depressed prices to repair balance sheets, diluting the shareholders who had ridden the decline down. Crisis-era REIT payout research documents how the cuts and the dilutive issuance traveled together through that repair phase.
The mechanics force that sequence. A REIT must keep distributing taxable income to keep its tax status, so it cannot quietly bank cash the way an operating company can, and because it borrows against property values, falling valuations mechanically raise leverage. Cutting the payout and issuing cheap equity becomes the pressure valve.
The 2020 split sharpens the underwriting lesson. The index was down roughly 5 percent for the year, but hotel and retail REITs absorbed brutal declines while industrial, data-center, and cell-tower names held up or gained. Leverage and tenant exposure decided outcomes, and those are the same two variables behind the client-concentration diligence you already run on your own revenue roster: too much debt, too few clients.
Treasuries in a Recession, and the Fine Print on Cash
The flight to safety is the one pattern that repeated in every episode. The 10-year Treasury yield history shows yields falling through 2008, from around 4 percent toward 2, and collapsing to record lows below 1 percent in 2020 as investors paid up for certainty. Meanwhile the 3-month T-bill series shows short yields pinned near zero after the Fed's cuts, and staying near zero for years after 2009 and again through 2020.
So Treasuries and cash equivalents did their one job: nominal value held in all three recessions, and longer Treasuries posted genuine price gains in 2008 and 2020. The fine print is that the income side collapsed with policy rates. Money market funds in a downturn follow the Fed down, so your defensive tier keeps its dollar value while its yield evaporates, and rolling T-bills means reinvesting at whatever the crisis-era rate happens to be.
The 2022 rate shock supplies the caveat: cash is not risk-free outside the recession scenario. Inflation ran high while cash yields were still catching up, and even short-term Treasury funds showed small mark-to-market losses as rates rose. Safe, here, means nominal-price safety within the recession use case, nothing broader.
Where to Park Side Hustle Income Before a Recession

Now convert the record into a plan. This is what investing during a recession looks like in practice for a variable earner: three tiers, funded in strict order.
Tier 1, Operating Cash Sized to Your Income Swing
Start from essential monthly expenses, then size the buffer against volatility rather than a generic rule. Say essentials run $3,200 a month and your trailing two years show the worst quarter averaging 35 percent below normal income. A standard three-month fund ($9,600) assumes your revenue snaps back instantly. Sizing to the observed swing argues for six to nine months of essentials, $19,200 to $28,800, and self-employed emergency fund guidance commonly lands variable earners well above the salaried baseline for exactly this reason. Park it in a high-yield savings account or a money market fund. If you want the emergency fund question for freelancers reduced to one line: size to your worst documented stretch, not to someone's average.
Tier 2, Defensive Reserves in Short Treasuries
Money with a known purpose inside one to three years, plus any cushion beyond Tier 1's target. T-bill ladders and short Treasury funds keep the flight-to-safety behavior documented above with minimal duration risk.
Tier 3, Long-Horizon Risk Capital
Only money with no plausible use for three to five years goes here, in a diversified equity mix, plus REITs only if you accept the drawdown and payout-cut profile above.
The rule that holds it together is the funding order. Every side-hustle dollar fills Tier 1 to target first, then Tier 2, and only the overflow buys Tier 3; after any draw on Tier 1, refill it before investing again. Someone with essentials near $1,400 a month and an extra $700 a month fills a six-month Tier 1 in about a year, then builds short Treasuries, and starts buying equities only once both tiers are intact. That sequence is what prevents forced selling at the bottom in a 2008-style drawdown: the investor who entered that crisis with nine months of essentials in cash had no reason to liquidate a single depressed share, while the under-buffered investor turned a temporary loss into a permanent one.
| Asset | Documented worst of the three | Recovery to prior high | Where it belongs |
|---|---|---|---|
| Cyclical stocks | Roughly -57% (2007 to 2009) | About four years from the 2009 low | Tier 3 only |
| High-yield bonds | Spreads near 20 points, deep 2008 losses | Slow and credit-dependent | Not a safety tier |
| REITs | Roughly -38% in 2008 with dividend cuts | Years | Tier 3, sized for payout swings |
| Treasuries | Nominal value held at the short end; price gains in 2008 and 2020 at longer maturities | n/a | Tier 2, short-dated |
| Cash, T-bills, money market | Nominal value held in all three | n/a | Tier 1 and Tier 2 |
Five Mistakes That Hit Variable Earners Hardest
- Selling risk assets during an income dip. When side revenue dries up in month four of a drawdown, unbuffered hustlers become forced sellers. Guardrail: Tier 1 sized to your worst historical stretch, refilled before any new investing.
- Chasing yield in high yield. A fat junk yield in calm markets is compensation for a spread that can double or triple in a crisis. Guardrail: treat junk as Tier 3 risk, never as the defensive tier.
- Treating REIT dividends as bond coupons. The 2008 experience brought cuts, suspensions, and dilution. Guardrail: underwrite leverage and sector exposure, and treat the payout as discretionary.
- Sizing cash off the standard rule. Three to six months of expenses assumes salary stability you may not have. Guardrail: compute your actual worst quarter and hold against it.
- Assuming 2020 speed is normal. A months-long recovery happened once, with historic stimulus behind it. Guardrail: plan on the 2008 path and treat anything faster as upside.
Investing during a recession with irregular income is a sequencing problem before it is a selection problem. Size the cash tier to the income swing, keep near-term money in instruments that held nominal value through every modern downturn, and buy the risk tier only with money that can wait out a multi-year recovery. Get the order right and the asset list mostly takes care of itself.
Stay in the loop.
Get the latest posts and exclusive content delivered to your inbox.
Join 20 readers. No spam. Unsubscribe in one click, anytime.
About the author
Marcus Reed
Staff Writer
Marcus writes about side hustles and extra income, from gig apps and freelancing to online business and investing, drawing on public data, platform reports, and reputable sources.
Related Posts

Portfolio Rebalancing Without Selling in a Taxable Account
Portfolio rebalancing for side hustle income: use lumpy deposits to fix asset allocation drift in a taxable account before selling winners.

Retirement Planning With Variable Income Without a Paycheck
Retirement planning with variable income needs new math. Set an income floor, sweep surplus months by rule, and discount hustles with a shelf life.

What a Brokerage Transfer Bonus Pays per Hour
Brokerage transfer bonuses promise free money. Price the ACAT fees, tax basis, and lost yield first to see when the reward beats your hourly rate.